Why billing alone is not enough
A total monthly bill does not tell you which scripts are repeating, which automations retry too often, or where the same prompt patterns keep coming back.
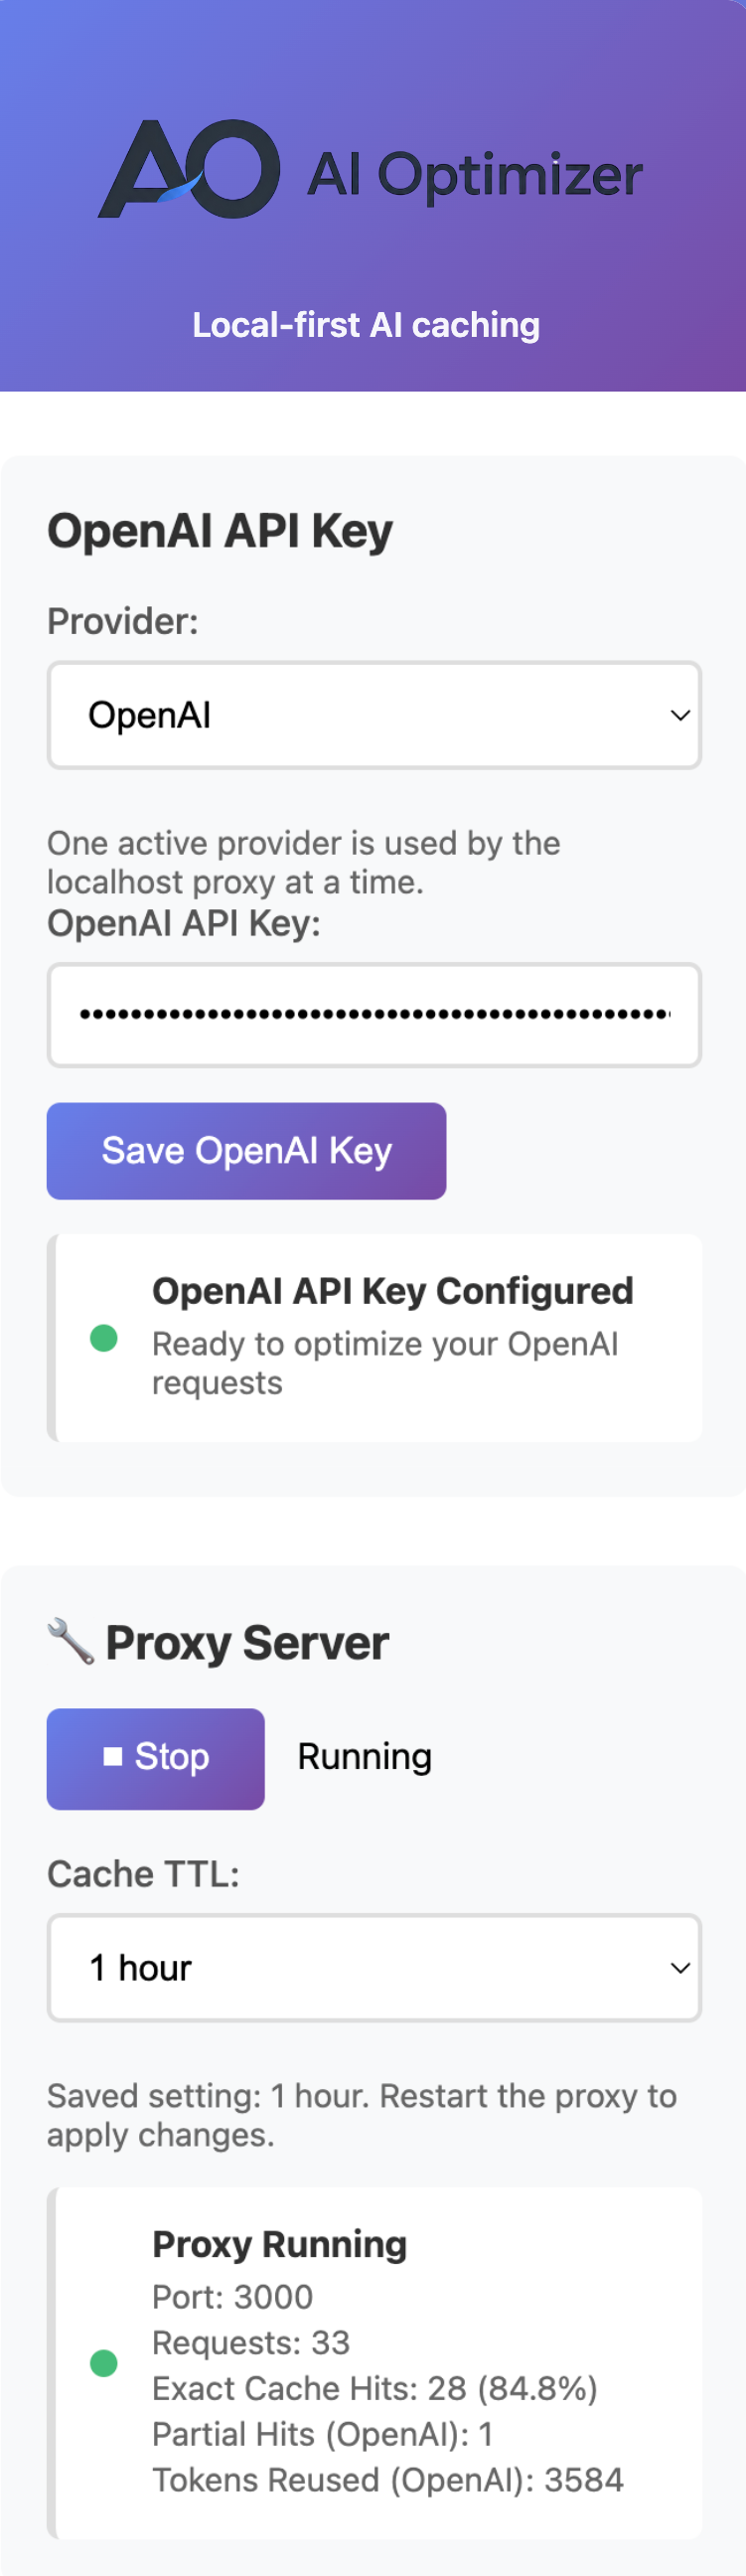
Monitoring local AI usage gets more useful when you can see request volume, repeated-workflow behavior, and cache signals from one place instead of guessing from a bill later.
One practical way to monitor OpenAI API usage in local workflows is to route traffic through a local control layer that shows requests, cache hits, and repeat-pattern behavior while the workflow is running.
A total monthly bill does not tell you which scripts are repeating, which automations retry too often, or where the same prompt patterns keep coming back.
Local visibility lets you catch repeated request patterns closer to where they happen, which makes optimization and debugging easier.
The most useful signals are usually operational, not theoretical.
How much AI traffic is actually passing through the workflow.
Whether repeat-heavy work is being reused locally instead of paid again.
Whether request bodies stay similar enough over time to benefit from caching.
Developers, operators, automation builders, and teams running internal tools, cron jobs, or agent workflows usually benefit most from this kind of visibility.
Once you can see repeated traffic clearly, it becomes much easier to decide where caching or workflow changes will actually matter.
AI Optimizer gives local workflows a clearer way to monitor usage, catch repeat behavior, and prove where savings are actually coming from.